Pyramid Diagrams
Pyramid diagrams are a form of projective geometry that shows the small group relation between dichotomies. They are currently being a developed in the English community by Andrew Joynton, but may have already been discovered in the east.
The purpose of a pyramid diagram is to provide a visual way to work with the structures in socionics.
Diagram Elements
Points represent dichotomies. Points can be written as a plus or minus charge to indicate a given trait
Lines represent a small group relation between three dichotomies. Rules
Each dichotomy is divided into a positive and negative trait. For the small group relations to work, all positive traits need to match one of the sixteen types. Reinin used ILE as the standard base type, but any type works.
Any two of the three dichotomies on each line can generate the same small group.
There must be an odd number of positive traits on each line. If two of the three charges are given, they can be multiplied to result in what the third charge must be.
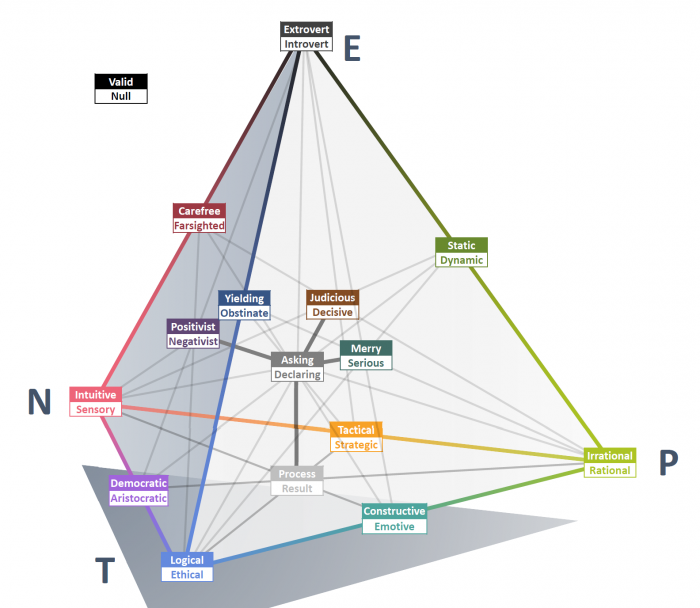
Type Dichotomy Pyramid
In this diagram, each box is a dichotomy, the upper colored trait is positive and the lower white trait is negative. Each line represents a small group. Ten circular lines have been excluded from this version to increase legibility.